Many people view 12% body fat as an optimal ratio. You’re lean enough to see muscle definition, but not so lean that it becomes extreme.
But does 12% body fat really look the way people imagine in real life? Is it healthy? And how do you measure it accurately?
The answer depends on the individual. What 12% body fat looks like varies based on multiple factors, including sex, muscle mass, and genetics. Therefore, 12% body fat is not a suitable long-term goal for everyone.
In this article, we’ll explain what 12% body fat means, whether it is healthy, and how to approach it safely.
What Does 12% Body Fat Mean?
Body fat percentage measures the amount of your total body weight that is composed of fat, rather than muscle, bone, organs, or water.
For example, if you are 180 pounds and are at 12% body fat, approximately 22 pounds of that weight is fat, and the remaining 158 pounds is lean mass.
Why does this matter? The scale is not indicative of everything. Two people could weigh the same and still look drastically different. One person could have a greater amount of muscle mass, whereas the other has a greater amount of fat mass. Body fat percentage provides additional context and is significantly more valuable than weight by itself.
What Does 12% Body Fat Look Like?
It's important to understand that there is no single "look" associated with body fat percentage. Your body type, lighting, muscle mass, hydration, posture, and genetics all factor into how lean you look. 12% is generally considered lean and athletic, but how it looks on your body depends on your muscle mass and how you naturally store fat.
12% Body Fat in Men

Typically, at 12%, most men will have a visibly lean and athletic build.
You should see defined abs, clear separation of the chest and shoulders, defined arms, and minimal body fat around the waist area. The face typically also appears sharper.
Keep in mind that 12% does not look the same for everyone. For instance, a male who has more lean mass will likely appear to be much more defined than a male who has less lean mass at the same body fat percentage. Additionally, genetics and body fat distribution contribute greatly to this variance. Some males tend to store fat in the lower abdominal region, while others tend to store it in their hips or upper back.
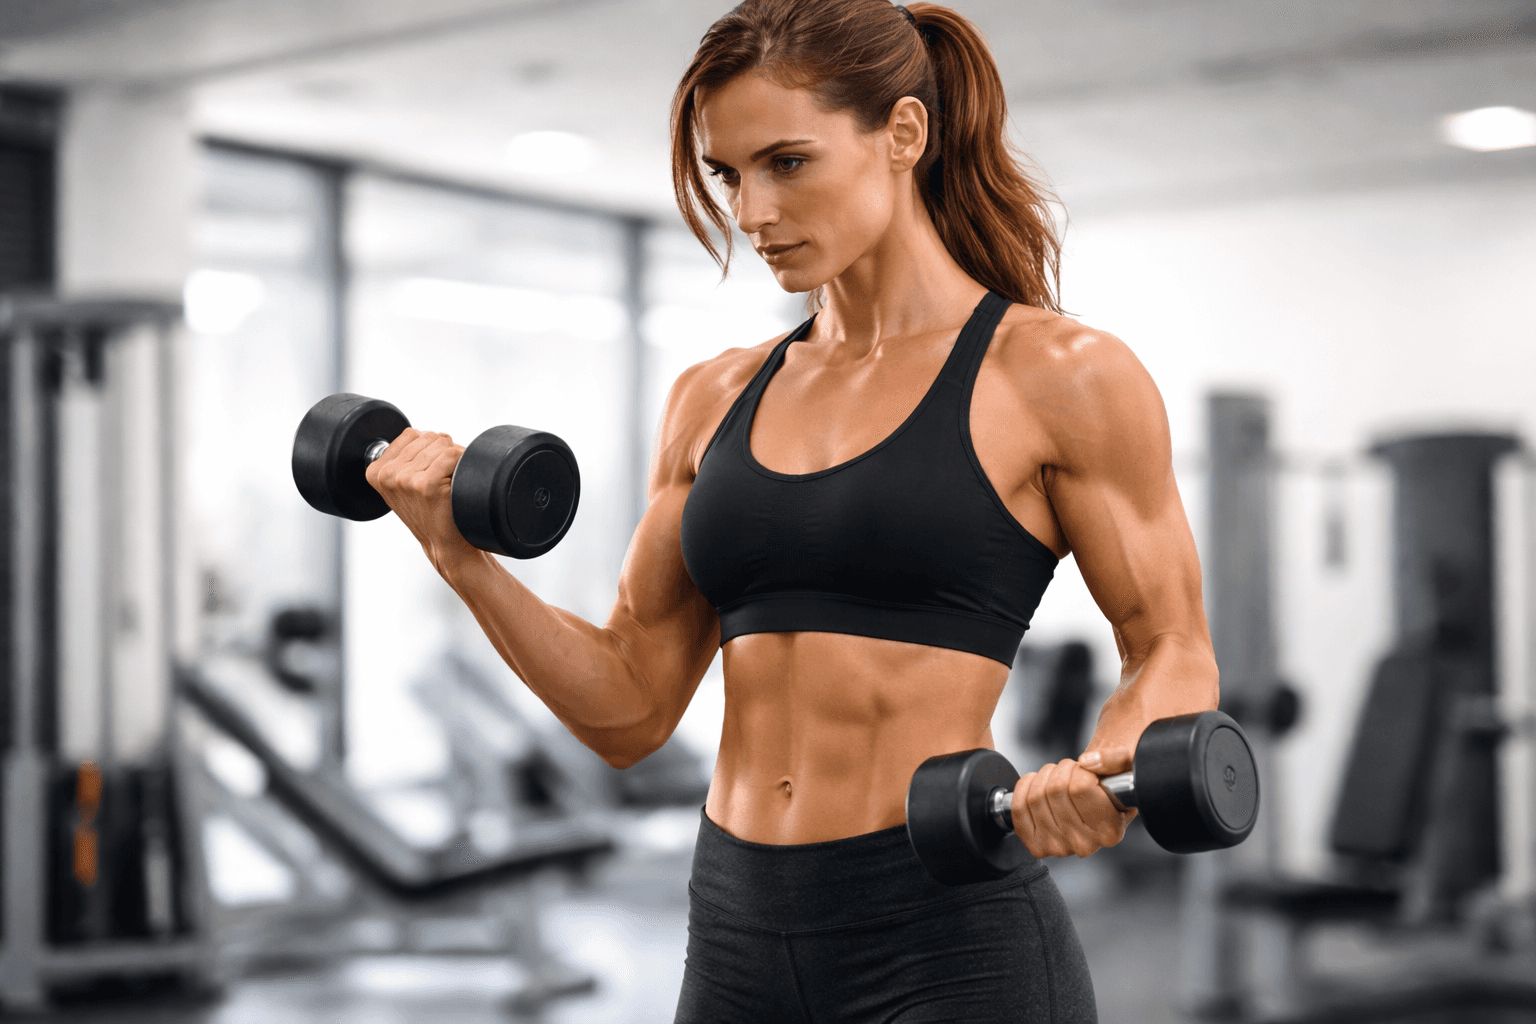
12% Body Fat in Women

At 12%, women’s body fat is extremely lean and approaches essential fat levels needed to support normal physiological function.
At this percentage, muscle definition will be very apparent. Ab lines may be visible, the shoulders and arms will appear sharply defined, and overall body fat will be low. Breast tissue and natural fat storage will be noticeably decreased.
From a health standpoint, maintaining this body fat percentage for extended periods is challenging because women require more essential fatty acids to support hormonal balance and reproductive health. Maintaining a body fat percentage of 12% or lower for extended periods can increase the risk of menstrual irregularities, low energy, reduced bone density, and increased risk of injury.
For most non-competitive women, maintaining a higher body fat percentage is healthier and more sustainable.
Is 12% Body Fat Healthy?
Whether 12% body fat is healthy depends on the individual. A specific body fat percentage may be realistic for some individuals but difficult or unsustainable for others. Factors that contribute to this variability include age, sex, training volume, stress, sleep, and genetics. The key question is not simply "Can you achieve 12%?" but "Can you sustain it without feeling weakened and/or impaired?"

For Men
For most men, achieving 12% through gradual methods, along with proper nutrition and recovery, falls into a healthy, athletic range.
Although appearance is one factor in determining health, there are many others to consider. Steady energy, good training performance, stable moods, quality sleep, and healthy hormone levels are all vital indicators of health. If recovery is consistently poor, or you feel tired all the time, then that level may be too low for you.
For Women
For women, 12% is extremely close to the essential fat levels. This may be an attainable goal in the short term for competitive female athletes; however, it is rarely attainable in the long term.
Signs to continually monitor include menstrual regularity, bone health, thyroid function, stress, and overall energy. If your menstrual cycle stops or you experience prolonged fatigue, raising your caloric intake and body fat will be required to support your overall health.
How Long Does It Take to Reach 12% Body Fat?
The honest answer is it depends on where you are starting.
You can safely lose body fat at a rate of 0.5 percent to 1 percent of body weight per week. Losing body fat faster is often associated with the loss of muscle and/or energy.
For instance, a man who loses body fat from 18-20% to 12% will likely take three to five months to reach his goal. Women who move their body fat percentage from 22 to 25 percent toward the mid to high teens will also have a similar time frame.
However, when you rush through the body fat loss process, there are an increased number of risks, including the loss of muscle, changes in hormone levels, and a decline in your ability to perform during your workouts.
Sustainable body fat loss involves a slow, consistent reduction in body fat, which preserves lean body mass.
How to Reach 12% Body Fat Safely
Reaching 12% body fat is not about extreme dieting or endless cardio. The goal is to lose fat while keeping muscle, strength, and energy intact. The safest approach combines proper nutrition, strength training, and recovery.
1. Maintain a Moderate Calorie Deficit
Fat loss typically requires a moderate caloric deficit, though the appropriate amount varies by individual. This allows steady fat loss without overwhelming your body. Crash dieting may speed up weight loss at first, but it often leads to muscle loss, fatigue, and rebound weight gain.
2. Prioritize Protein Intake
Higher protein intake is often recommended to help preserve lean mass during fat loss. Protein helps preserve muscle, supports recovery, and keeps you full longer. This becomes even more important as you get leaner.
3. Strength Train Consistently
Regular resistance training, often centered on compound movements, helps preserve muscle while losing fat. Without it, muscle loss is much more likely.
4. Use Cardio Strategically
Daily movement matters. Many people target 8,000 to 10,000 daily steps, plus 1 to 3 cardio sessions per week if needed. Too much cardio combined with a low-calorie diet can increase fatigue and slow recovery.
5. Prioritize Sleep and Stress Control
Getting 7 to 9 hours of sleep per night is generally associated with better recovery and metabolic health. Poor sleep disrupts hunger hormones, reduces recovery, and makes fat loss harder. Managing stress also helps regulate hormones that influence fat storage and energy levels.
How to Measure 12% Body Fat Accurately
If you are aiming for a specific body fat percentage, guessing based on the mirror is not enough. Lighting, dehydration, sodium intake, and even a recent workout can change how lean you look. That is why measurement matters.
No method is perfect, but some are more reliable than others.
Common Body Fat Measurement Methods
Method | Accuracy Level | What to Know |
DEXA Scan | Very High | Considered one of the most precise options. Expensive and not always easy to access. |
InBody Body Composition | High | Convenient and detailed. Results can vary based on hydration and timing. |
Skinfold Calipers | Moderate | Affordable and useful when performed by an experienced technician. |
Smart Scales | Variable | Sensitive to hydration and often inconsistent for precise tracking. |
Advanced body composition tools provide more than just a number. They can show total body fat percentage, lean mass, muscle distribution, and sometimes visceral fat estimates.
For best results, test under consistent conditions. Same time of day. Similar hydration. Ideally, before eating. Consistency matters more than chasing a perfect number.
Warning Signs You May Be Too Lean
You may think getting lean is great. However, when your body begins to push back against the changes you've made to get lean, it's time to listen to what your body is telling you.
When your body fat decreases, your ability to recover from a workout will also decrease, and the amount of stress on your body will increase. Look for the following warning signs:
Persistent fatigue regardless of rest
A decline in your strength or your gym performance, has stopped improving
An irritable mood, or low moods
Your sleep quality has decreased
You are getting sick more often than usual
Decreased libido
Irregular or missing menstrual cycles, for women.
These should not be considered minor issues. These are serious red flags that indicate your body fat may be too low for your current lifestyle. Simply increasing your caloric intake slightly and allowing your body fat to rise can help improve your energy levels, hormone production, and performance.
Should You Aim for 12% Body Fat?
It depends on why you want it.
12% may make sense if you compete in physique sports, need a strong power-to-weight ratio for performance, or can maintain stable energy, hormones, and overall health at that level.
But it is not a requirement for being fit or healthy.
If your priority is longevity, steady energy, strong training, and flexibility with food and social life, you may not need to be that lean. If you notice hormonal disruption or constant fatigue, it may not be right for you.
Body fat percentage is a tool to guide decisions, not a number everyone must chase.
Key Takeaways
12% body fat is very lean and athletic for men who train regularly and recover well. Some people can sustain this level. Most cannot.
Women who have a body fat percentage of 12% are at a critical point where they may be below the threshold of the minimum amount of body fat required to sustain health and wellness.
Having visible abdominal muscles does not automatically equate to optimal health. There are many other factors that determine health, such as your energy levels, hormone balance, sleep quality, mood, and performance.
Gradual weight loss helps retain muscle mass and support hormone function.
Conversely, rapid weight loss significantly increases the likelihood of burnout and subsequent rebound weight gain.
Choose a reliable measurement method, use it consistently, and most importantly, select a goal that allows you to stay strong and healthy.
Bottom Line
Reaching 12% body fat takes planning, consistency, and honest self-assessment. For some people, it marks a high level of athleticism. For others, it may be leaner than necessary.
The real question is not whether you can reach 12%. It is whether you can maintain it while keeping your energy, hormones, training performance, and overall well-being intact.
Use reliable measurements, focus on gradual progress, and adjust based on how your body responds. A healthy physique is one you can sustain without sacrificing quality of life.